 Kontakt
 Jak nakupovat
Doručení
Nákupní rádce
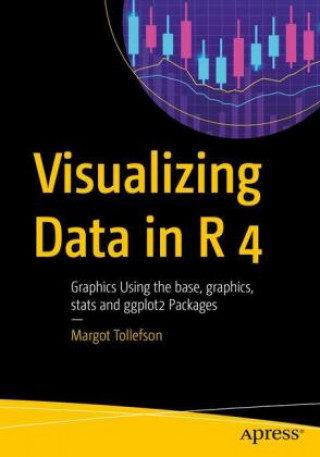
Visualizing Data in R 4
 Angličtina
 119 b
119 b
Až 30 dní na vrácení zboží
Zákazníci také koupili




Master the syntax for working with R's plotting functions in graphics and stats in this easy reference to formatting plots. The approach in Visualizing Data in R 4 toward the application of formatting in ggplot() will follow the structure of the formatting used by the plotting functions in graphics and stats. This book will take advantage of the new features added to R 4 where appropriate including a refreshed color palette for charts, Cairo graphics with more fonts/symbols, and improved performance from grid graphics including ggplot 2 rendering speed. Visualizing Data in R 4 starts with an introduction and then is split into two parts and six appendices. Part I covers the function plot() and the ancillary functions you can use with plot(). You'll also see the functions par() and layout(), providing for multiple plots on a page. Part II goes over the basics of using the functions qplot() and ggplot() in the package ggplot2. The default plots generated by the functions qplot() and ggplot() give more sophisticated-looking plots than the default plots done by plot() and are easier to use, but the function plot() is more flexible. Both plot() and ggplot() allow for many layers to a plot. The six appendices will cover plots for contingency tables, plots for continuous variables, plots for data with a limited number of values, functions that generate multiple plots, plots for time series analysis, and some miscellaneous plots. Some of the functions that will be in the appendices include functions that generate histograms, bar charts, pie charts, box plots, and heatmaps. What You Will Learn Use R to create informative graphics Master plot(), qplot(), and ggplot() Discover the canned graphics functions in stats and graphics Format plots generated by plot() and ggplot() Who This Book Is ForThose in data science who use R. Some prior experience with R or data science is recommended.


Informace o knize
Angličtina