
 Kontakt
 Jak nakupovat
Doručení
Nákupní rádce
 Angličtina
 138 b
138 b
Až 30 dní na vrácení zboží
Zákazníci také koupili


 /
/
 Brožovaná
 369
Kč
369
Kč




 /
Brožovaná
381
Kč
/
Brožovaná
381
Kč
 /
Brožovaná
512
Kč
/
Brožovaná
512
Kč


 /
Brožovaná
1 674
Kč
/
Brožovaná
1 674
Kč
 /
Brožovaná
1 014
Kč
/
Brožovaná
1 014
Kč






 /
Brožovaná
293
Kč
/
Brožovaná
293
Kč
 /
Brožovaná
590
Kč
/
Brožovaná
590
Kč
 /
Brožovaná
315
Kč
/
Brožovaná
315
Kč






 /
Brožovaná
1 196
Kč
/
Brožovaná
1 196
Kč

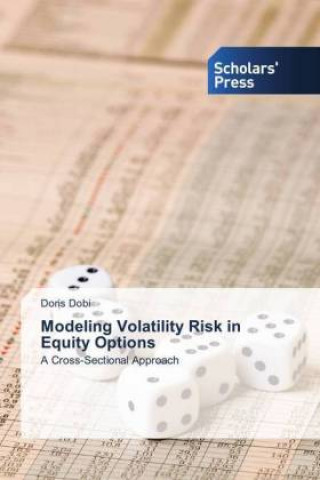
This paper provides a cross-sectional classification of optionable equities in U.S. Markets based on implied volatility data. For each security in the OptionMetrics database over the period from August 2004 to August 2013 we model its implied volatility surface (IVS). We then use the spectrum of the IVS, in particular the leading eigenvalue, to classify options into those carrying mostly systemic risk and into those carrying mostly idiosyncratic risk. We use implied volatility data across 13 different deltas and 4 expiration dates, hence our data on the options market is 52 times larger than that of the equities market. By employing methods from principal component analysis (PCA), and results from random matrix theory (RMT), we classify the significant eigenvalues and conclude that, usually, three principal components suffice to reproduce the IVS. In this way we reduce dimensionality without loosing any meaningful information. Using these results, we formulate an explicit model which can be used to describe the dynamics of the IVS, yet is compact and computationally feasible.


Informace o knize
Angličtina
Kategorie

Darujte tuto knihu ještě dnes
Je to snadné
1 Přidejte knihu do košíku a zvolte doručit jako dárek 2 Obratem vám zašleme poukaz 3 Kniha dorazí na adresu obdarovanéhoMohlo by vás také zajímat

 /
Brožovaná
432
Kč
/
Brožovaná
432
Kč





 /
Brožovaná
237
Kč
/
Brožovaná
237
Kč

 /
Brožovaná
1 014
Kč
/
Brožovaná
1 014
Kč






 /
Brožovaná
410
Kč
/
Brožovaná
410
Kč


 /
/
 Adobe ePub DRM
752
Kč
Adobe ePub DRM
752
Kč
 /
Brožovaná
576
Kč
/
Brožovaná
576
Kč

Ahoj! Jsem Libroamiko, tvůj knižní rádce.
Jak ti můžu pomoct?